Track and lower your electricity usage with the
LANTERN
POWER MONITOR


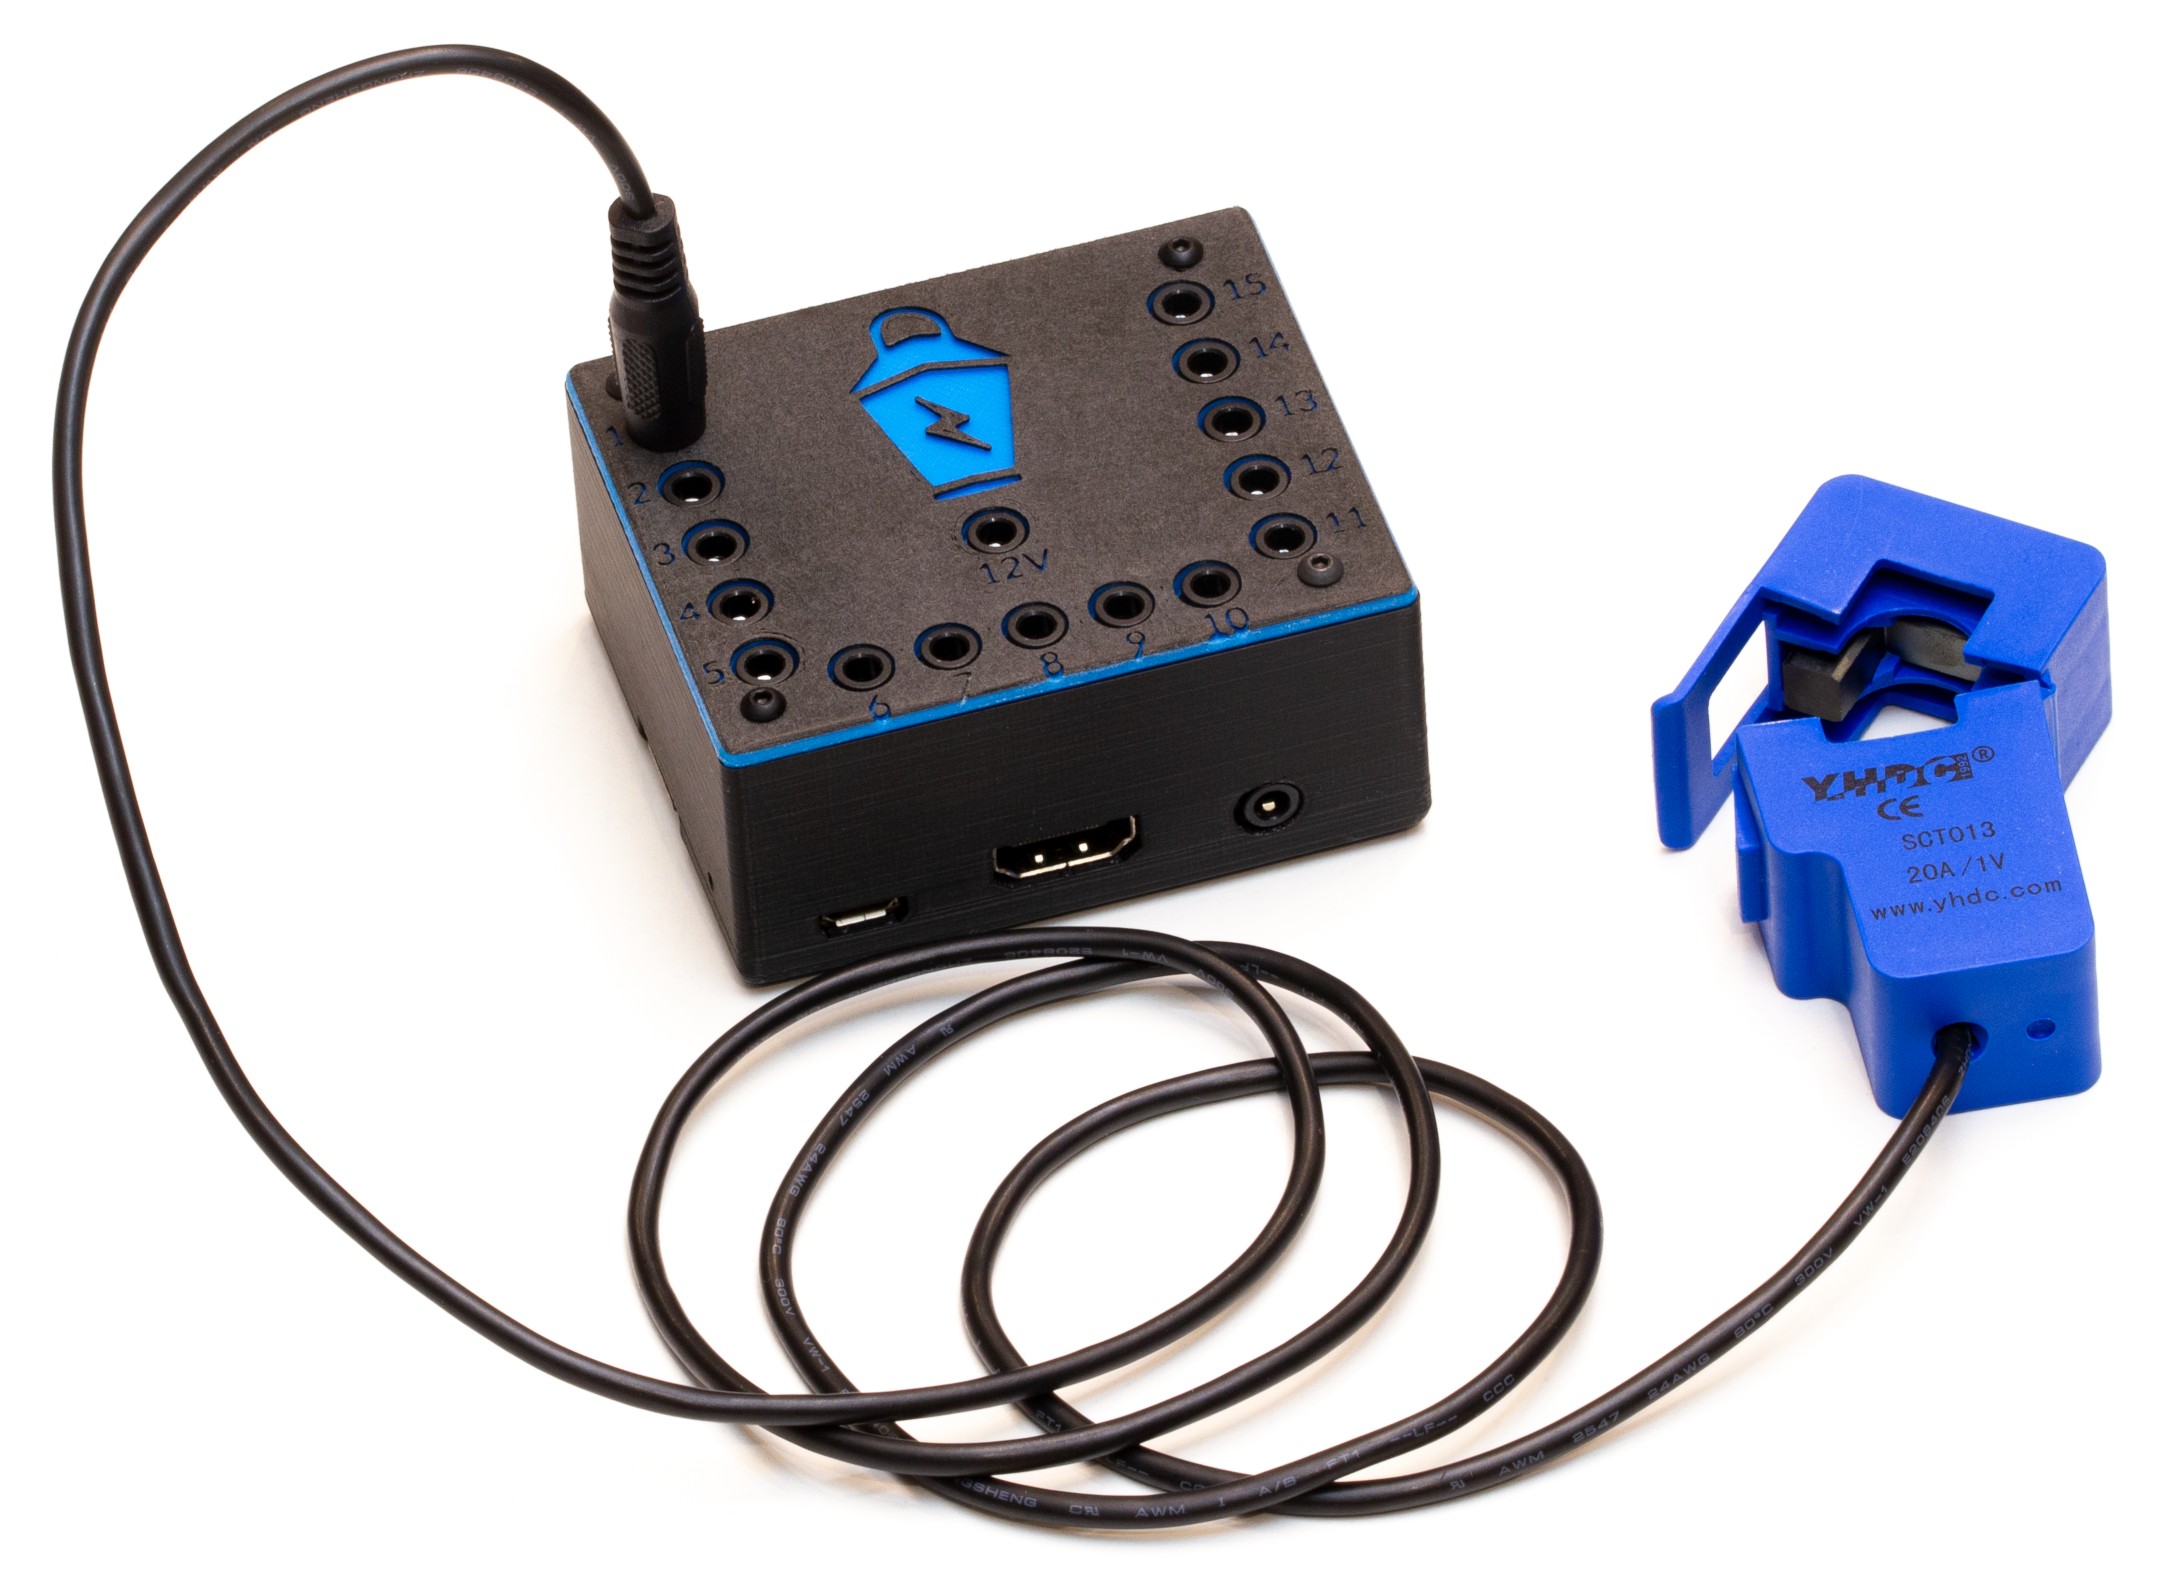
This Raspberry Pi-based power monitor gives you all of the data you need to
- Identify where every joule of electricity goes in your house
- Reduce your electricity consumption
- Accurately size a solar system
- Accurately size a battery system to go off grid
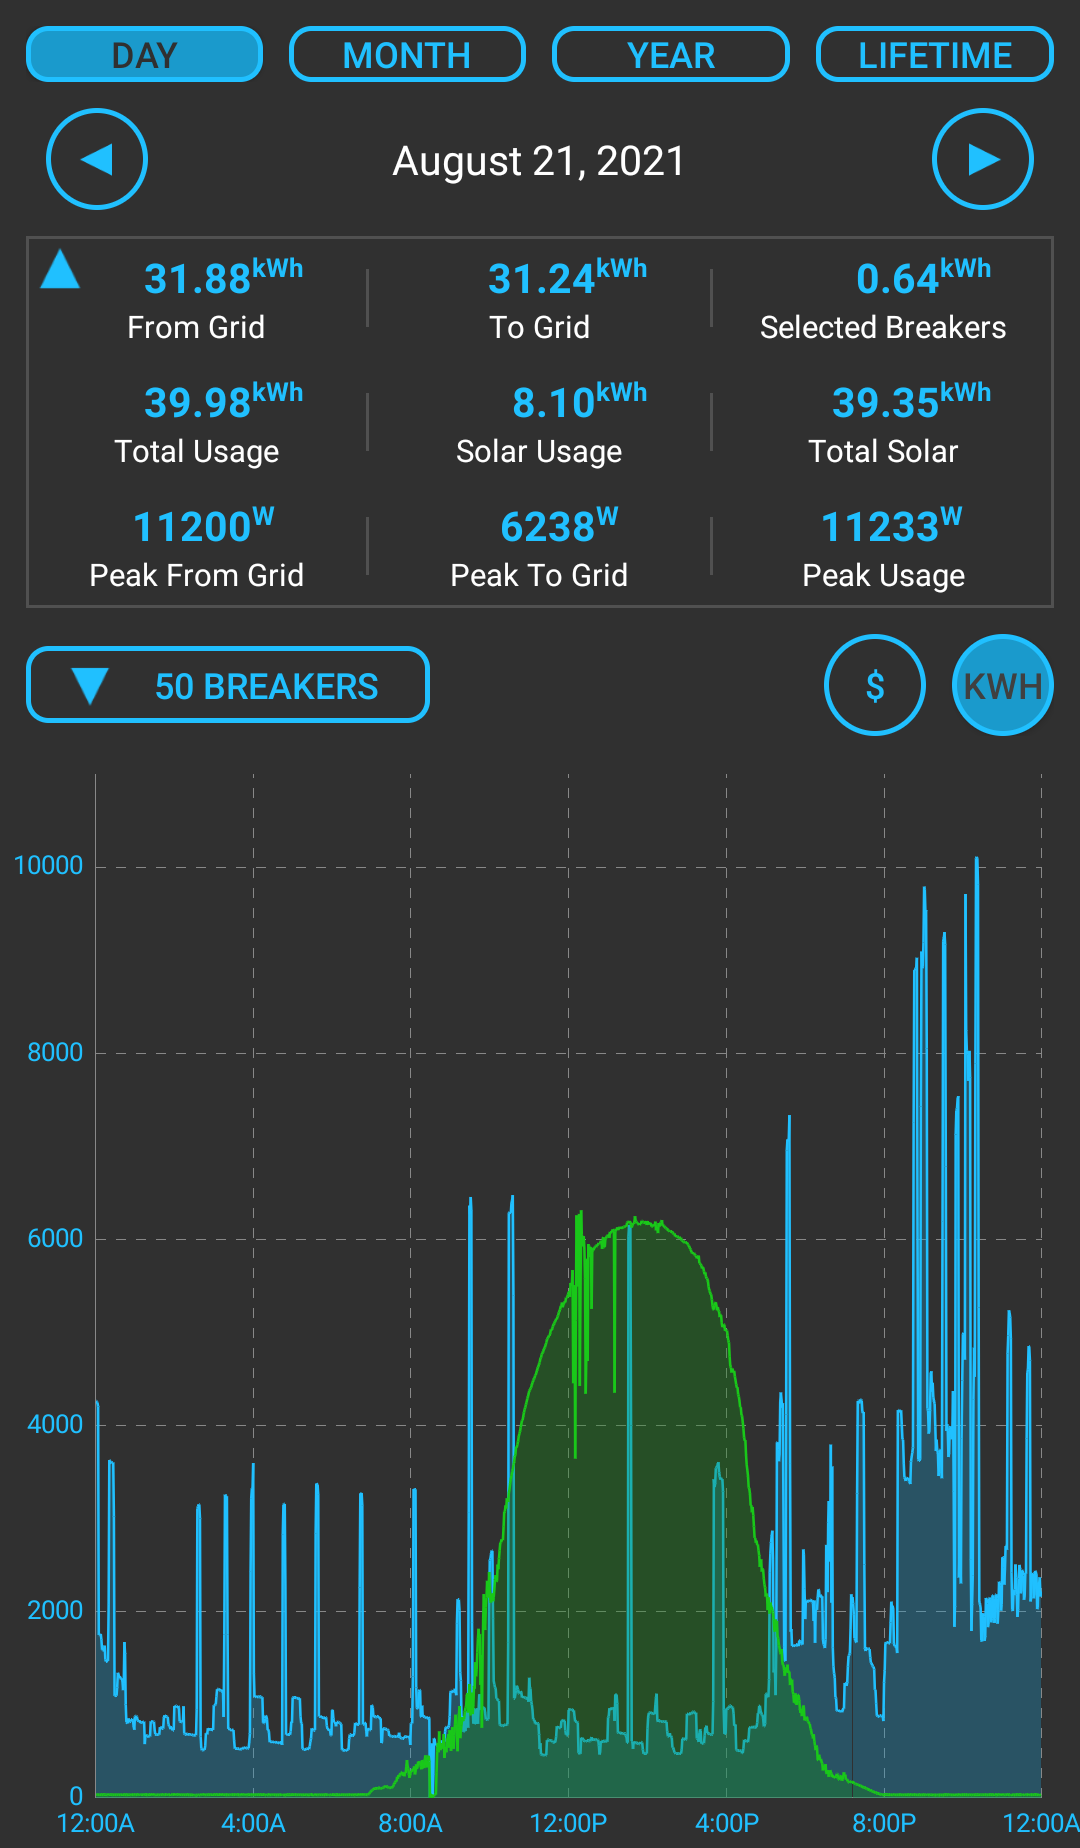
- See the live power of every breaker in your house as it updates every second
- Group your breakers into a hierarchy to help identify waste
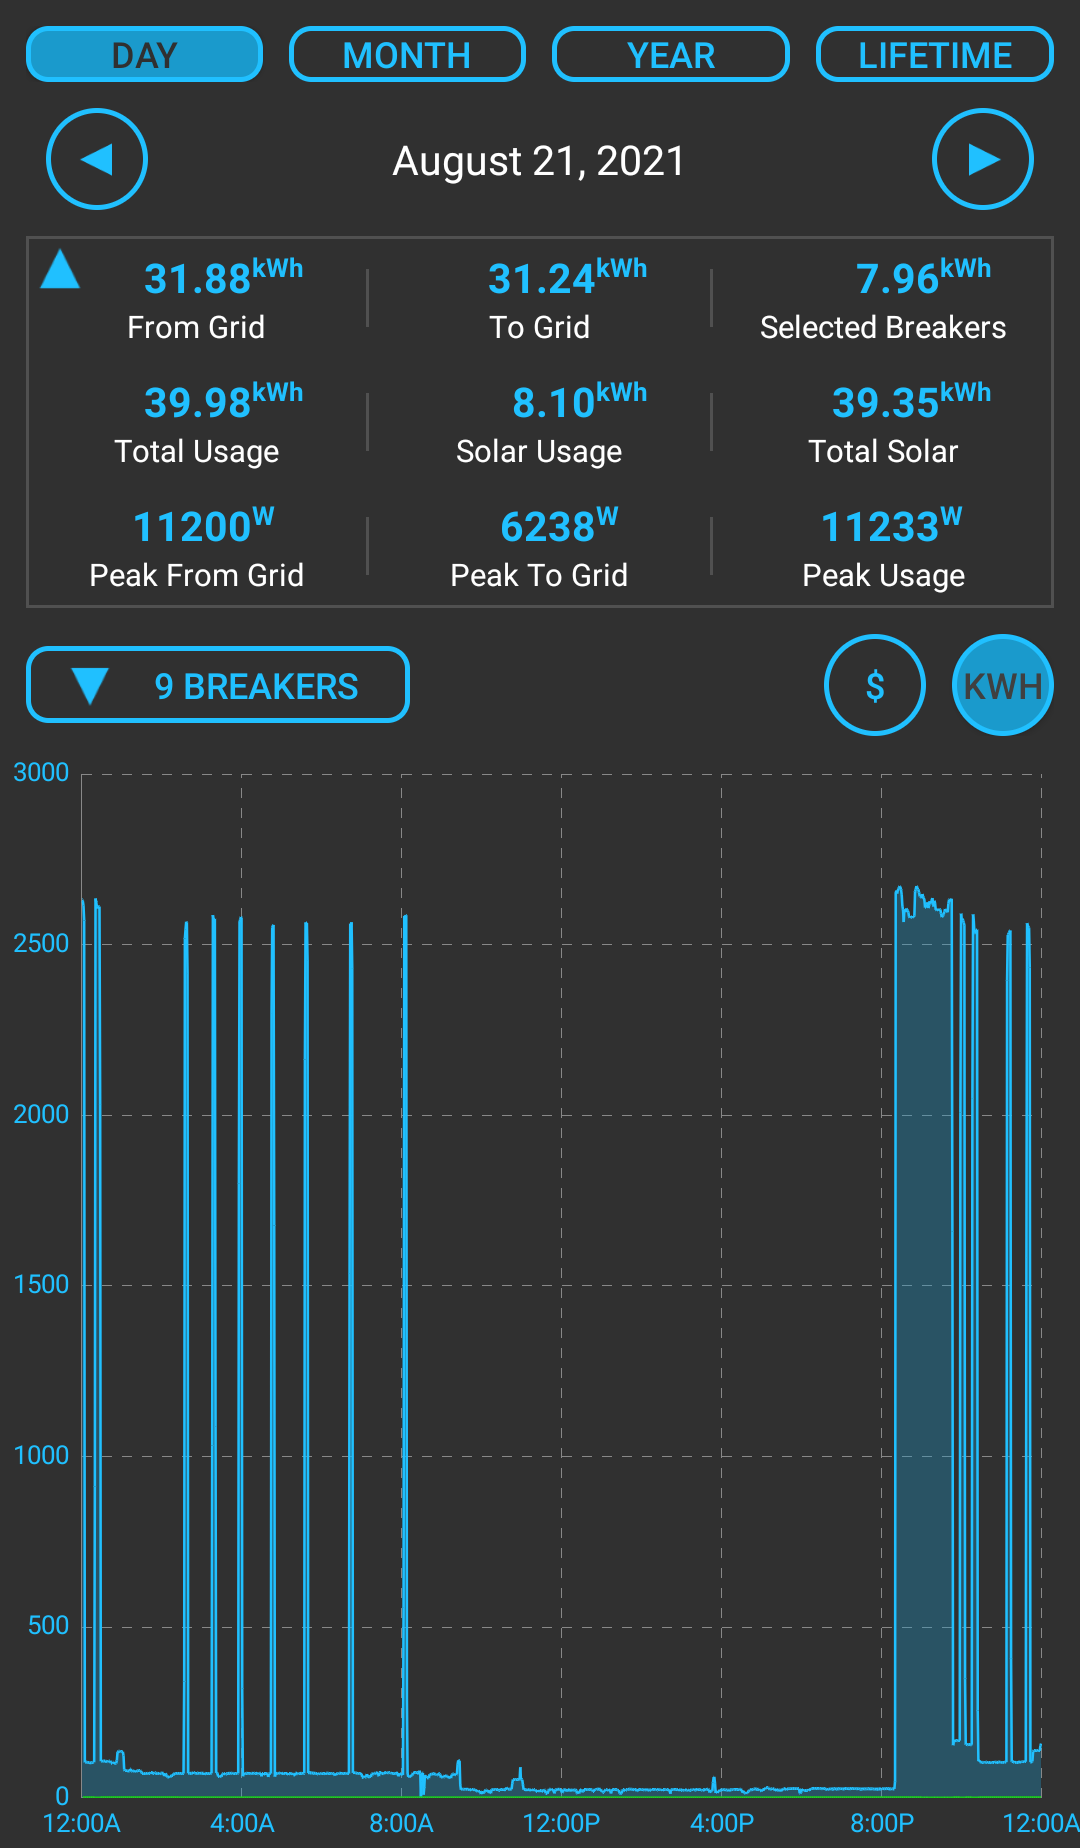
- Select specific groups or breakers to see the graph and totals for your selection
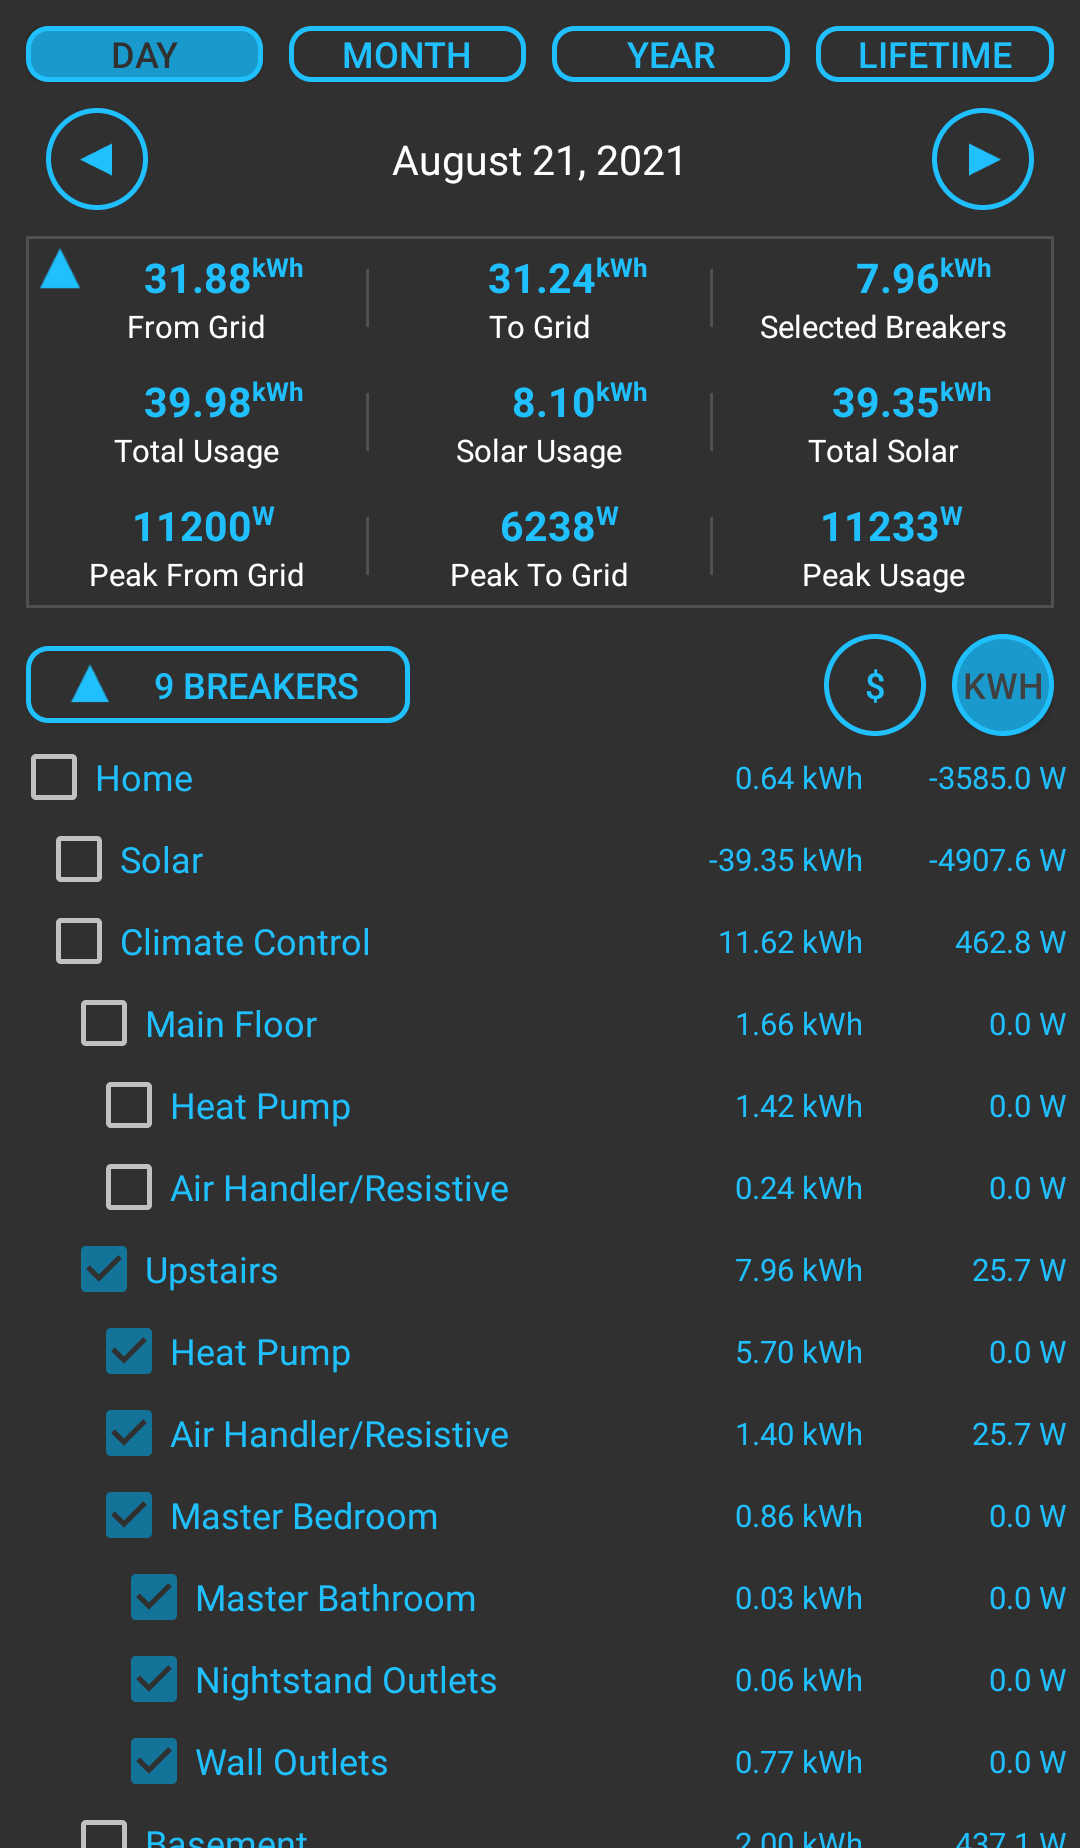
- No need to pre-configure graphs
- View any permutation of breakers on the fly
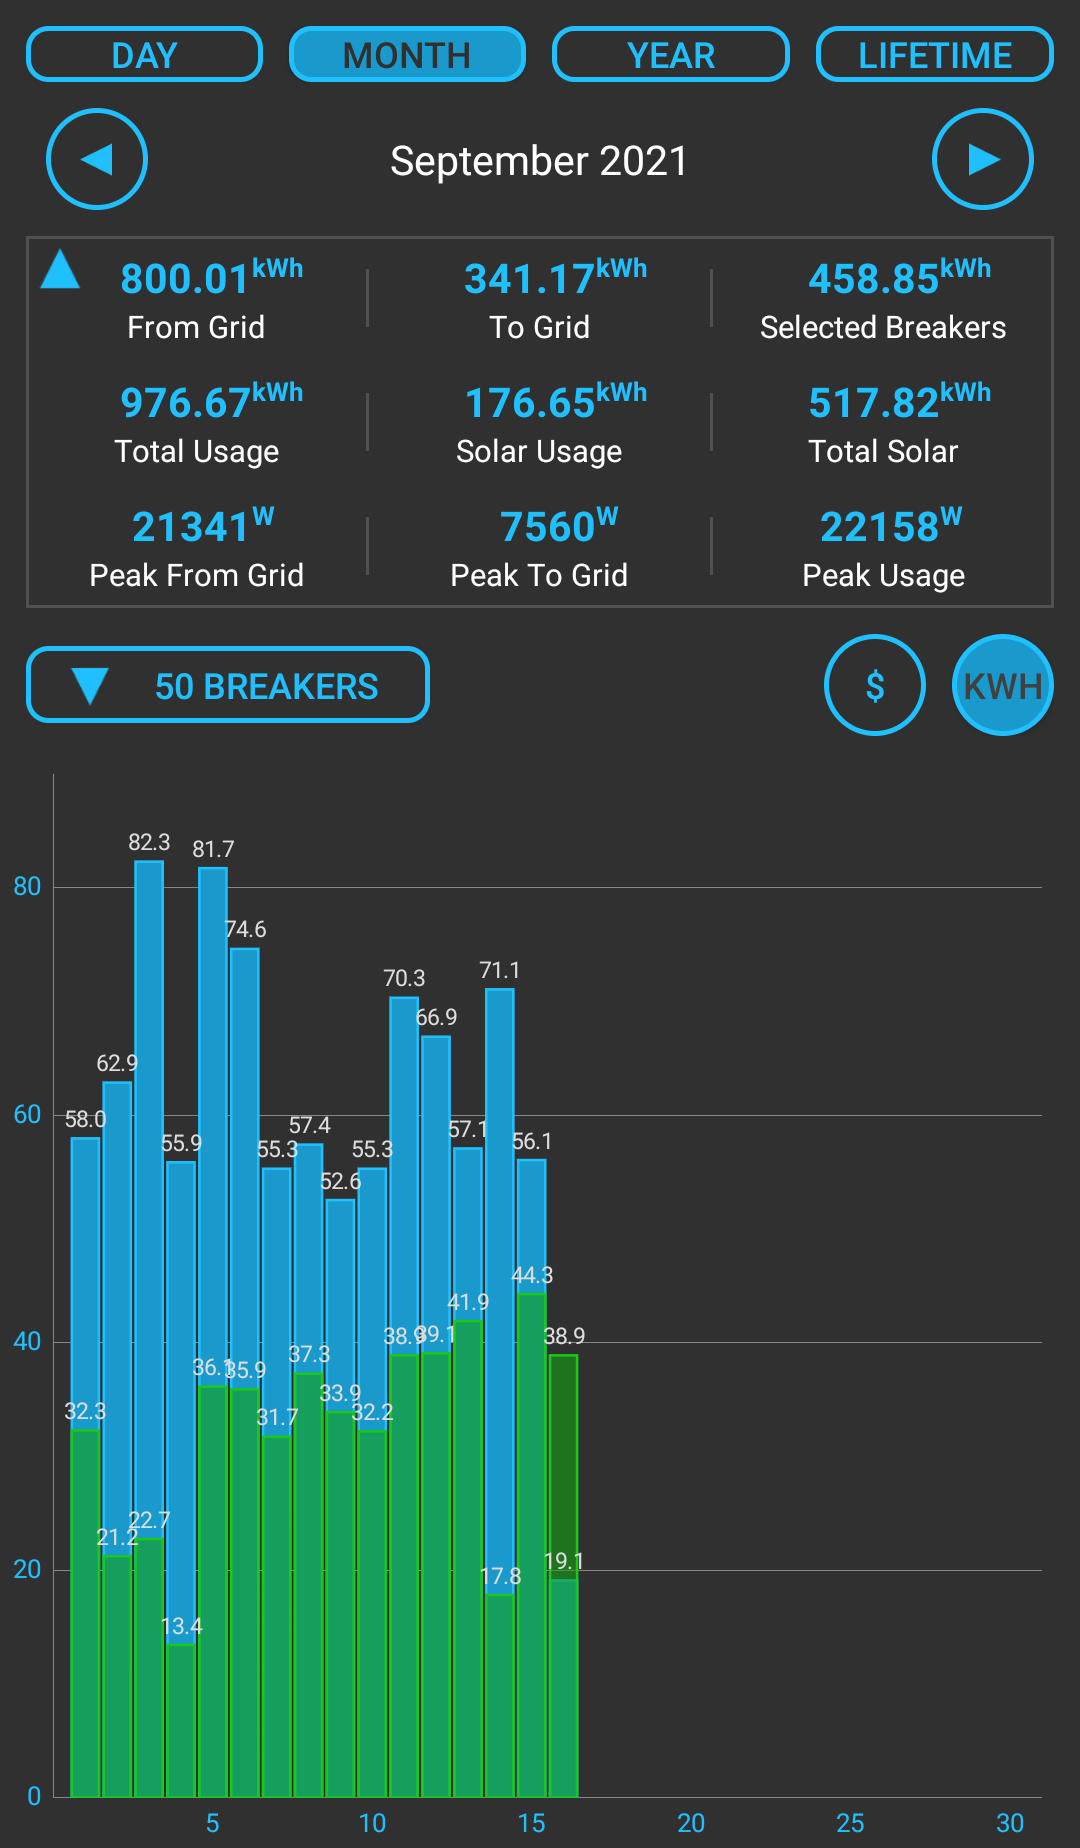
- Daily grid energy totals help you determine battery capacity needs
- Peak grid power helps you identify battery power needs
- Total energy and peak power values are available for any timeframe with no custom build required
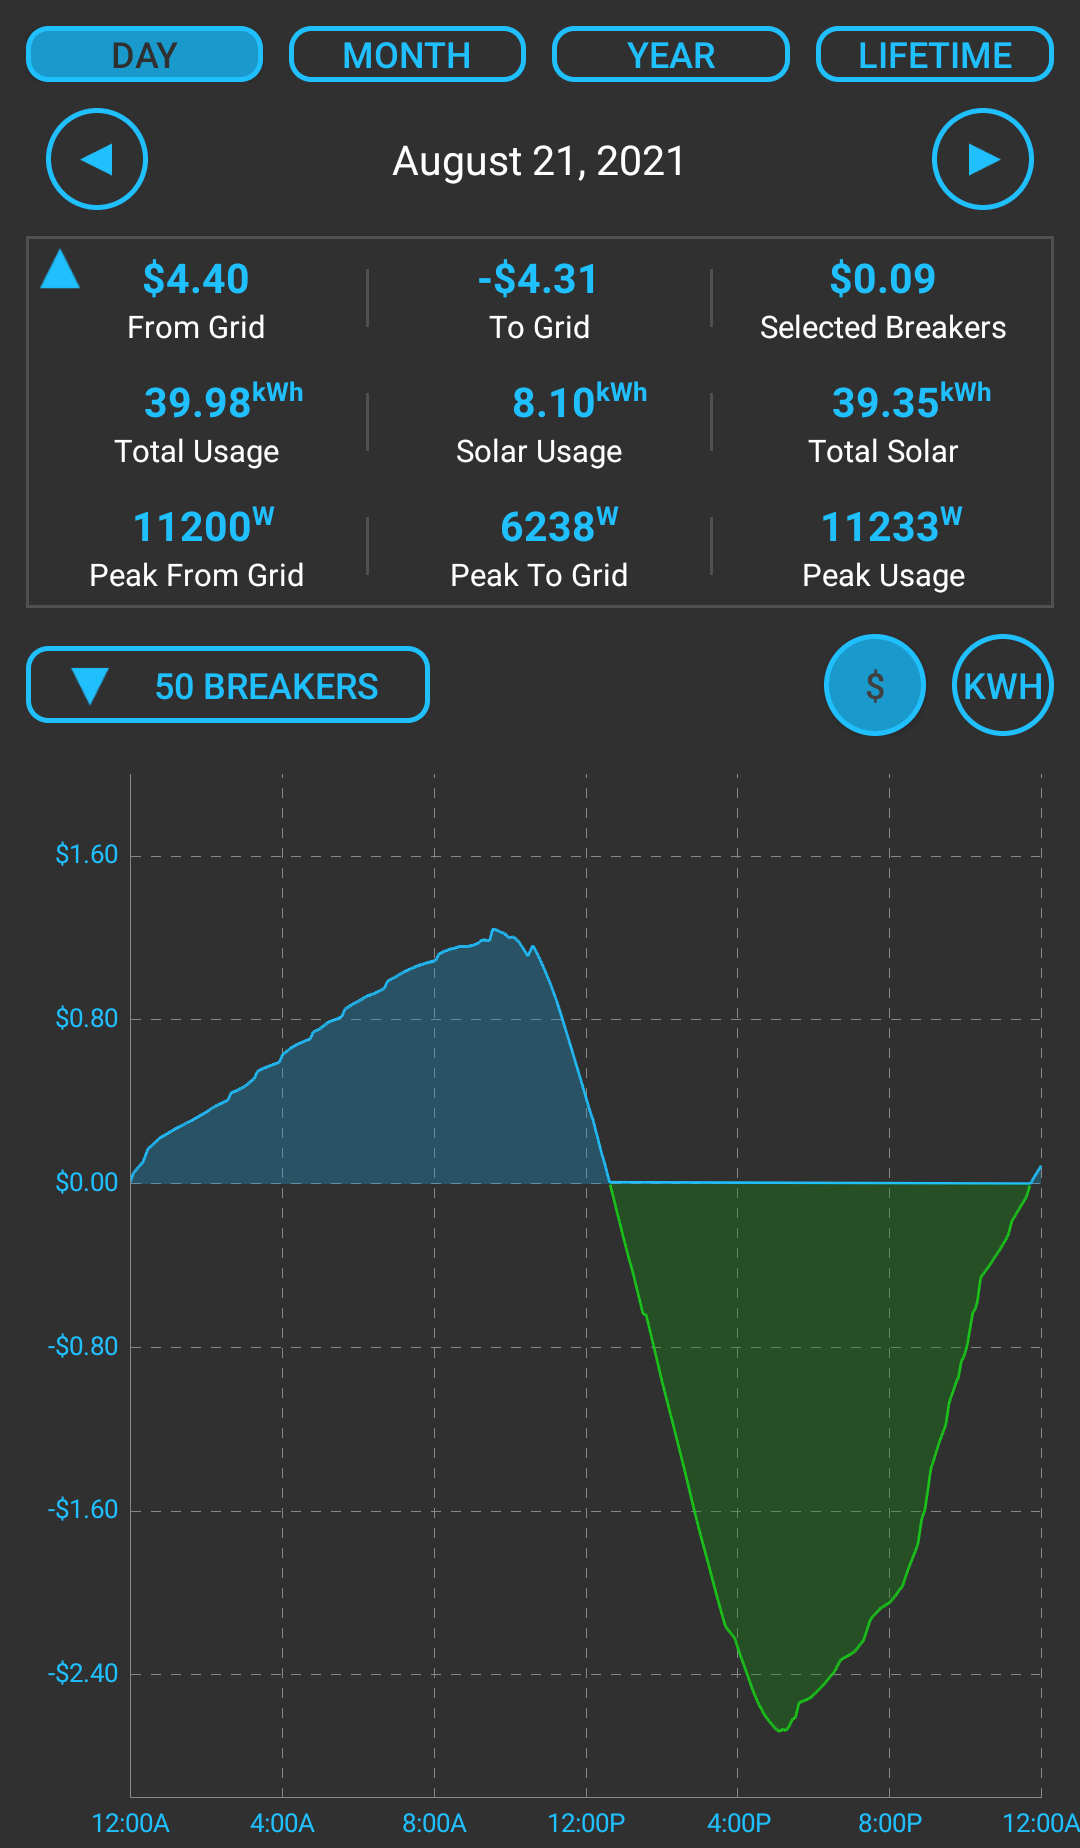
- Enter billing rates to see consumption and production in currency
- Billing rates can be applied to specific date ranges, times of day, kwh thresholds, and different rates for production vs consumption