The Lantern Power Monitor Origin Story
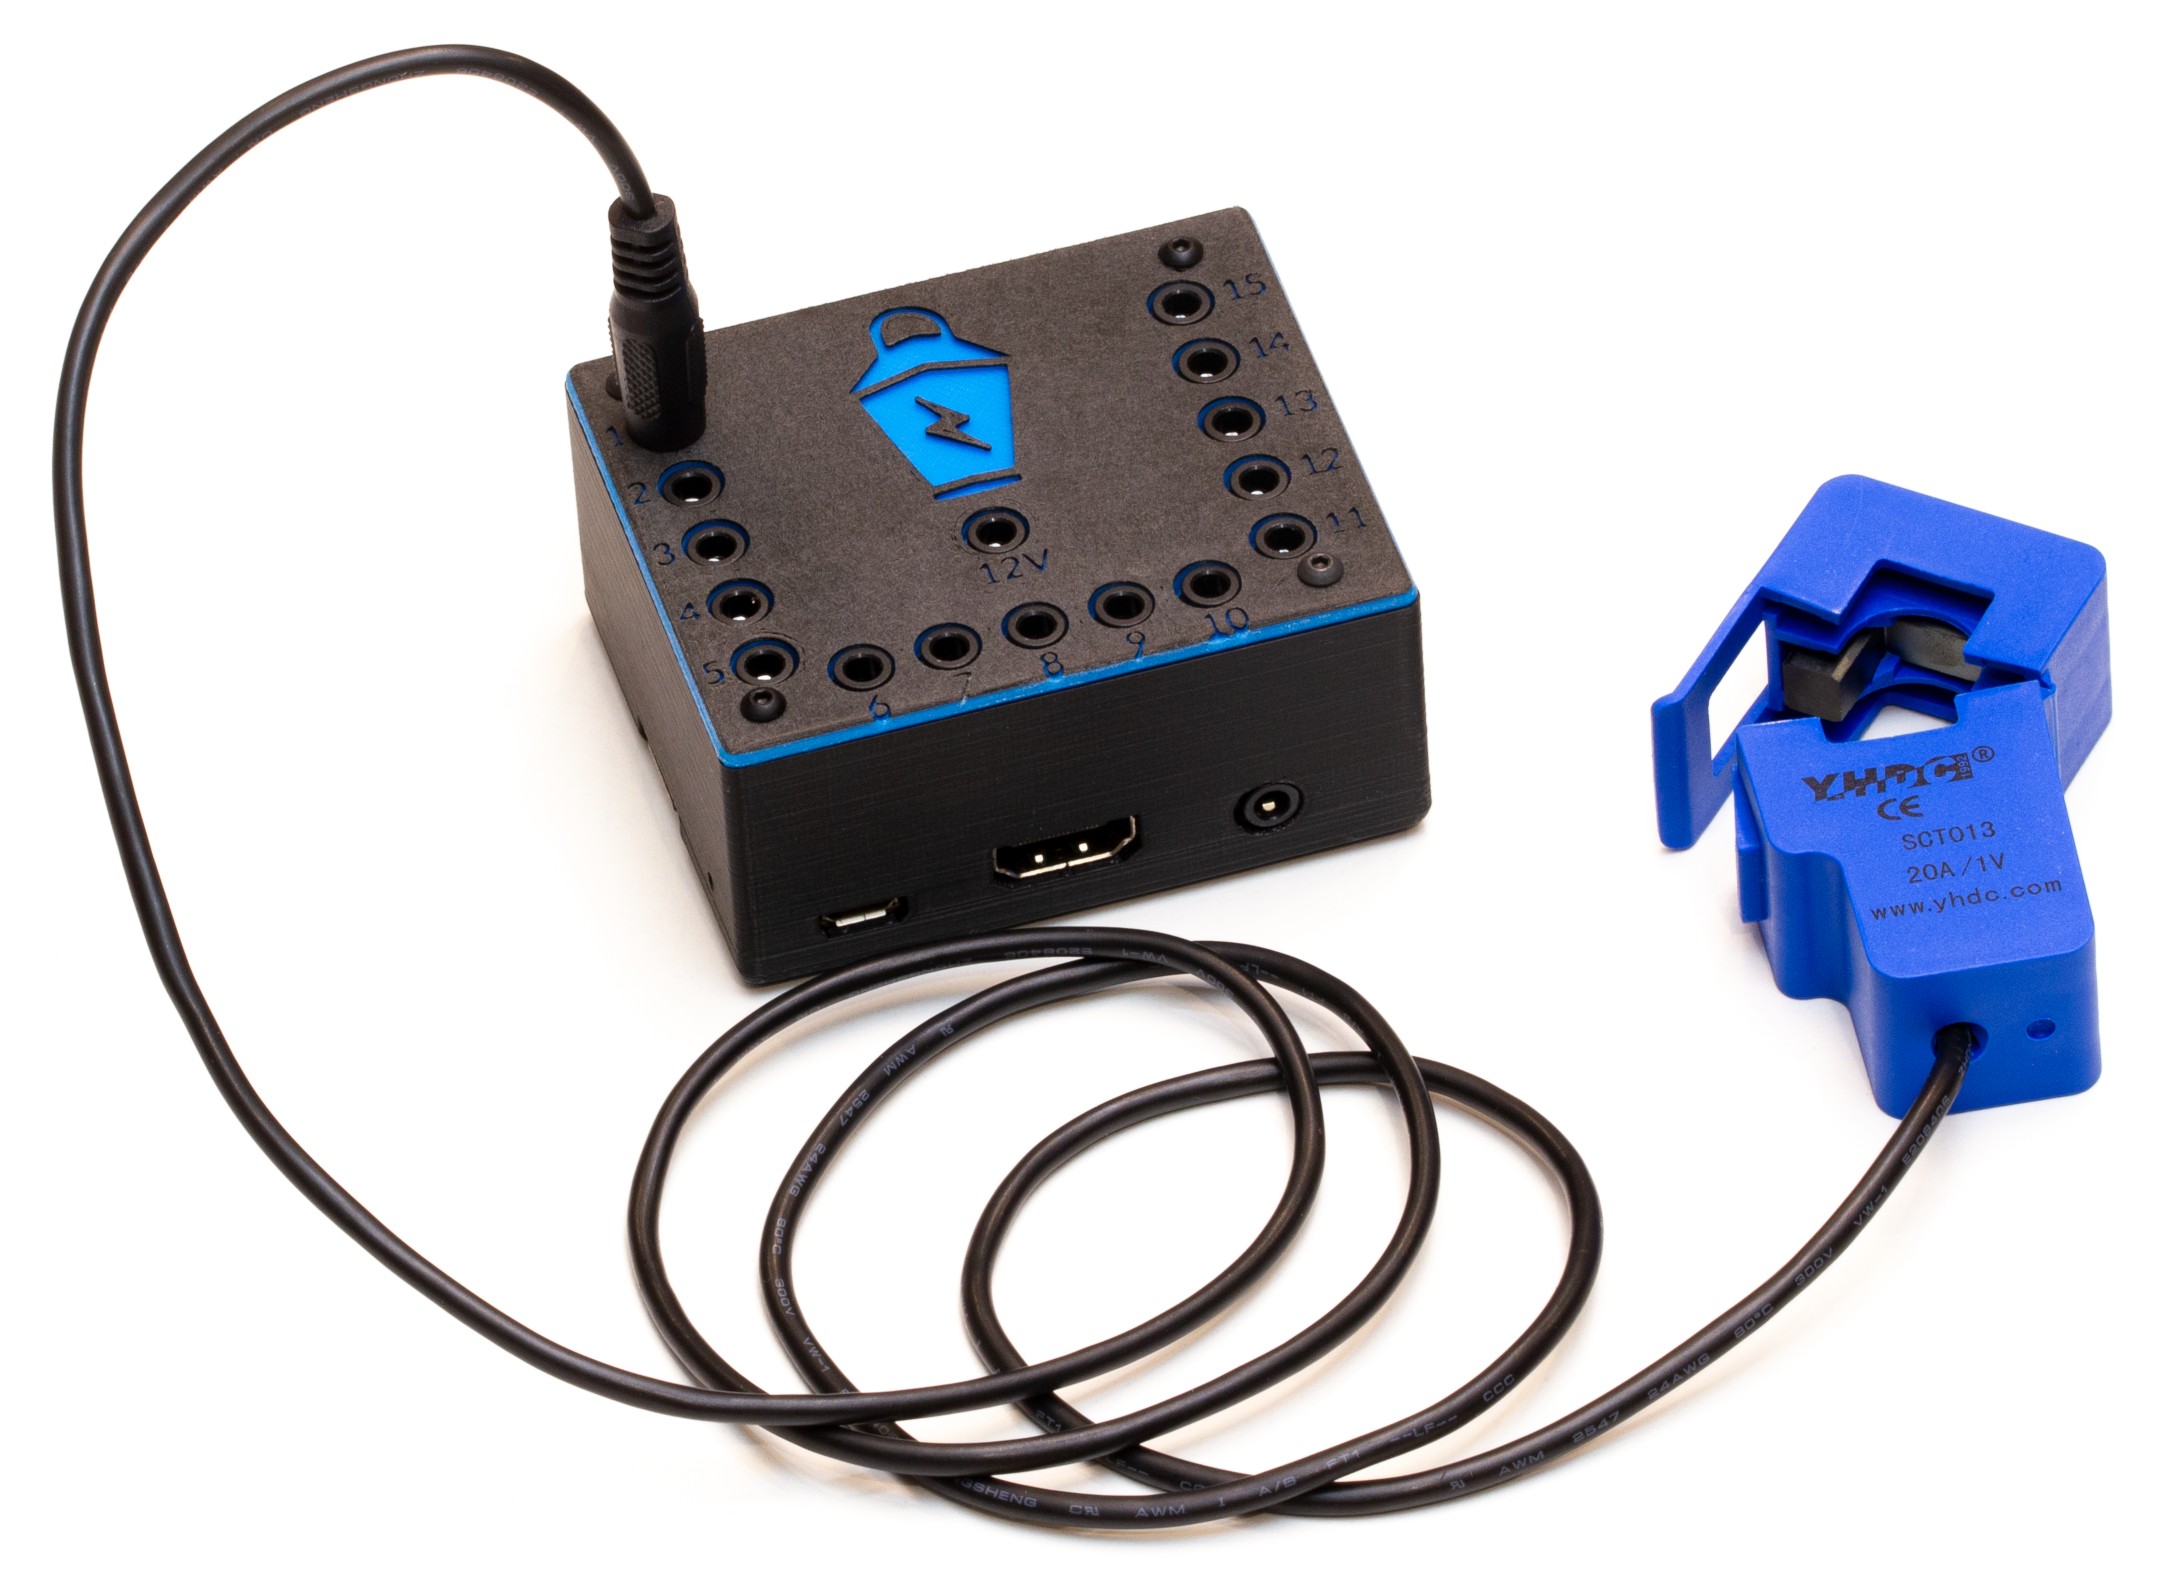
Hi, my name is Mark Milligan and I created the Lantern Power Monitor, a Raspberry Pi based power monitor that allows you to track every breaker in your home, no matter how many meters, panels, or breakers. I wanted to tell the story of how I came to build it and show a few of the interesting things I've learned about my own home's energy consumption along the way.
Proud Owners of an Inefficient Home
Back in 2017, I was living in a relatively small home here in Kansas City, Missouri with my wife, Cecilia, and our newborn son, Bruce. Bruce's arrival had prompted us to begin searching for a larger home. We wanted to find a four bedroom home that would allow our family to grow without needing to move ever again, or at least not until everyone was off to college. Feeling guilty about the prospect of owning a large home, we were interested in finding one that we could ultimately make carbon neutral. To me, that meant getting one that was all electric and had a large south-facing roof upon which we could place a large solar array.
After months of searching, we found our new home, a 3500 sq ft colonial that was built in the late eighties. With a simple, rectangular roof that faced south-southwest, it fit the solar criteria. As an all-electric home, it had two heat pumps, one for each floor, with electric resistance heat as backup. I inquired about the home's electricity consumption in the winter and learned that its worst month, February, was over $600. That figure scared us a little bit, and we thought it might be easier to look for land and build an efficient home from the ground up, rather than retrofit this old one. But, if we did that, this old house would still be sitting there, owned by someone else, burning through untold volumes of coal each year. And lest I make ourselves sound too altruistic, it also had an amazing back yard that was too good to resist.
So, the decision was made and we became the new owners of an inefficient 30 year old house. Where to begin? We handled all of the low-hanging fruit first. All of the incandescent lights were replaced with LEDs. The exterior doors whose jambs had started to sag were re-hung and weatherstripped. Fireplaces were caulked and plastic wrapped where cold winter air could be felt rushing through. The refrigerator, which was straight out of the 1987 Sears catalog, rattled and clanked so it was replaced. Those were the items that were inexpensive enough to tackle without really measuring if we were getting our money's worth by replacing them.
Now moving on to the more expensive items, the original windows were wooden frame with double pane glass. Many of them had a fog on the inside, indicating that their inert gas had escaped long ago and on a cold day we could feel a breeze coming through the side jamb. Those were no doubt one of the leading causes of that $600 winter electric bill. The heat pumps seemed to be in good condition but as it went below freezing, the flickering of the lights made it easy to tell that the electric resistance heat had kicked in to help. "Exactly how much power is it pulling that it makes the lights flicker?", I wondered. If those resistance heaters activate when it's below freezing, would we save money by putting a space heater in our bedroom and letting the rest of the house drop in temperature through the night? Why heat 3500 sq ft when we're sleeping in about 200 of that? And if we replaced the windows, how could we compare our energy consumption for two days with similar weather before and after replacing them? Can we isolate just the climate control from the usage information our electric company gives us? Probably not. I wasn't comfortable making a huge investment in new windows and new climate control without being able to measure exactly how much each change was helping.
In Need of Data
I started looking for a home power monitor that could help me track all of our usage so I could start optimizing these big ticket energy consumers in our house. There were really only two that stood out. One was a polished corporate product that only tracks the mains and tries to identify the signature of applicances using machine learning. As a software engineer having worked with machine learning, I was immediately skeptical that it would be able to identify anything but the most common appliances. At $350, I wasn't willing to gamble that it would give me the detail I wanted. The other was an open-source device that could track up to 14 breakers. By the time you added 14 current transformers it was almost $300 and with our house having 54 breakers, it would be over $1000 to track it all. Even if I were willing to make that investment, the UI was unsophisticated and it didn't provide simple ways of viewing different subsets of data. It did integrate with several other open source projects, but their UIs also seemed lacking.
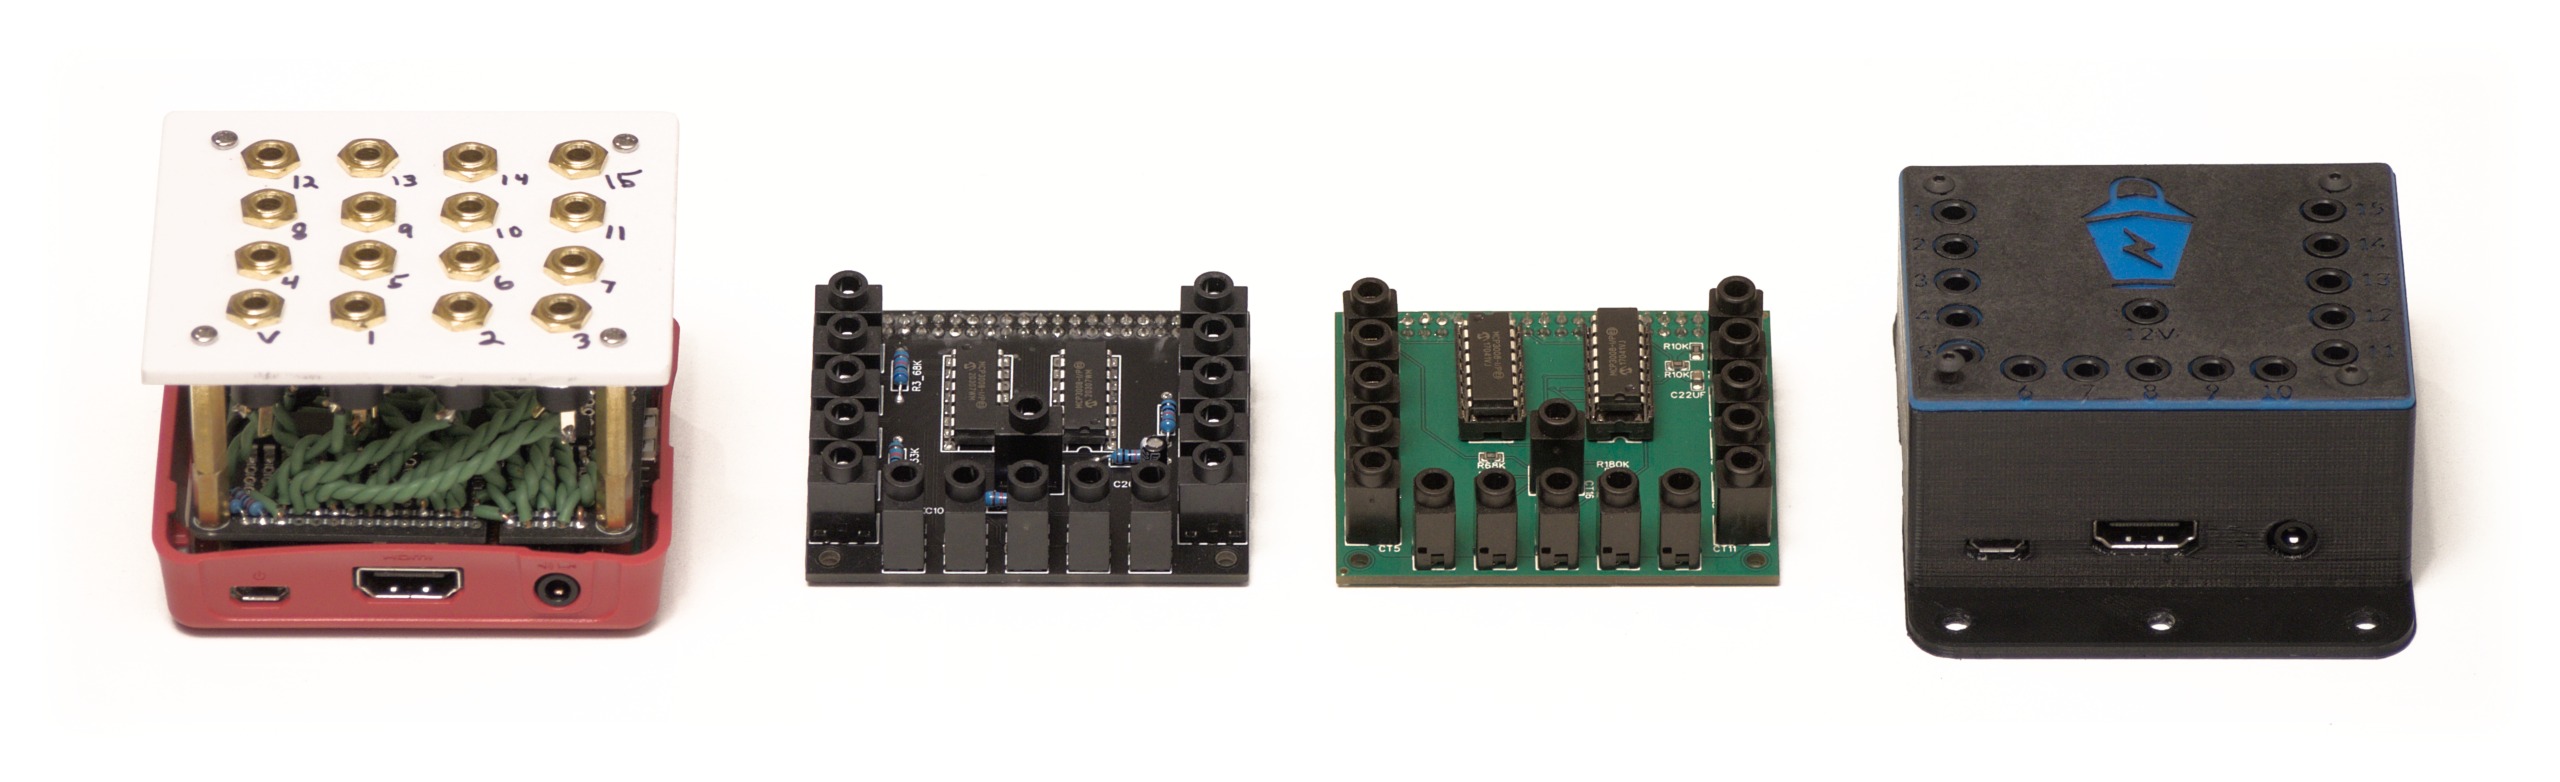
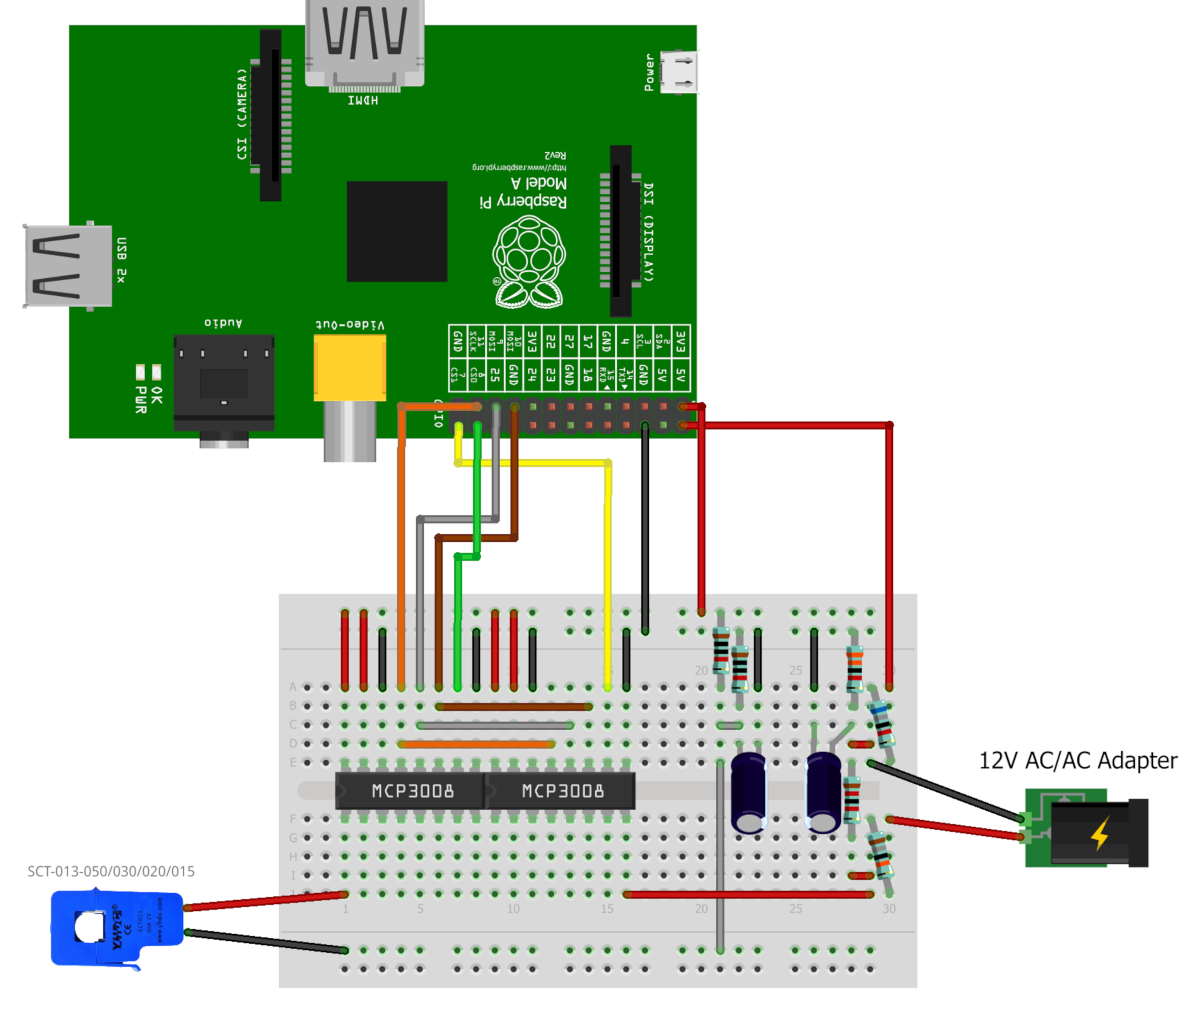
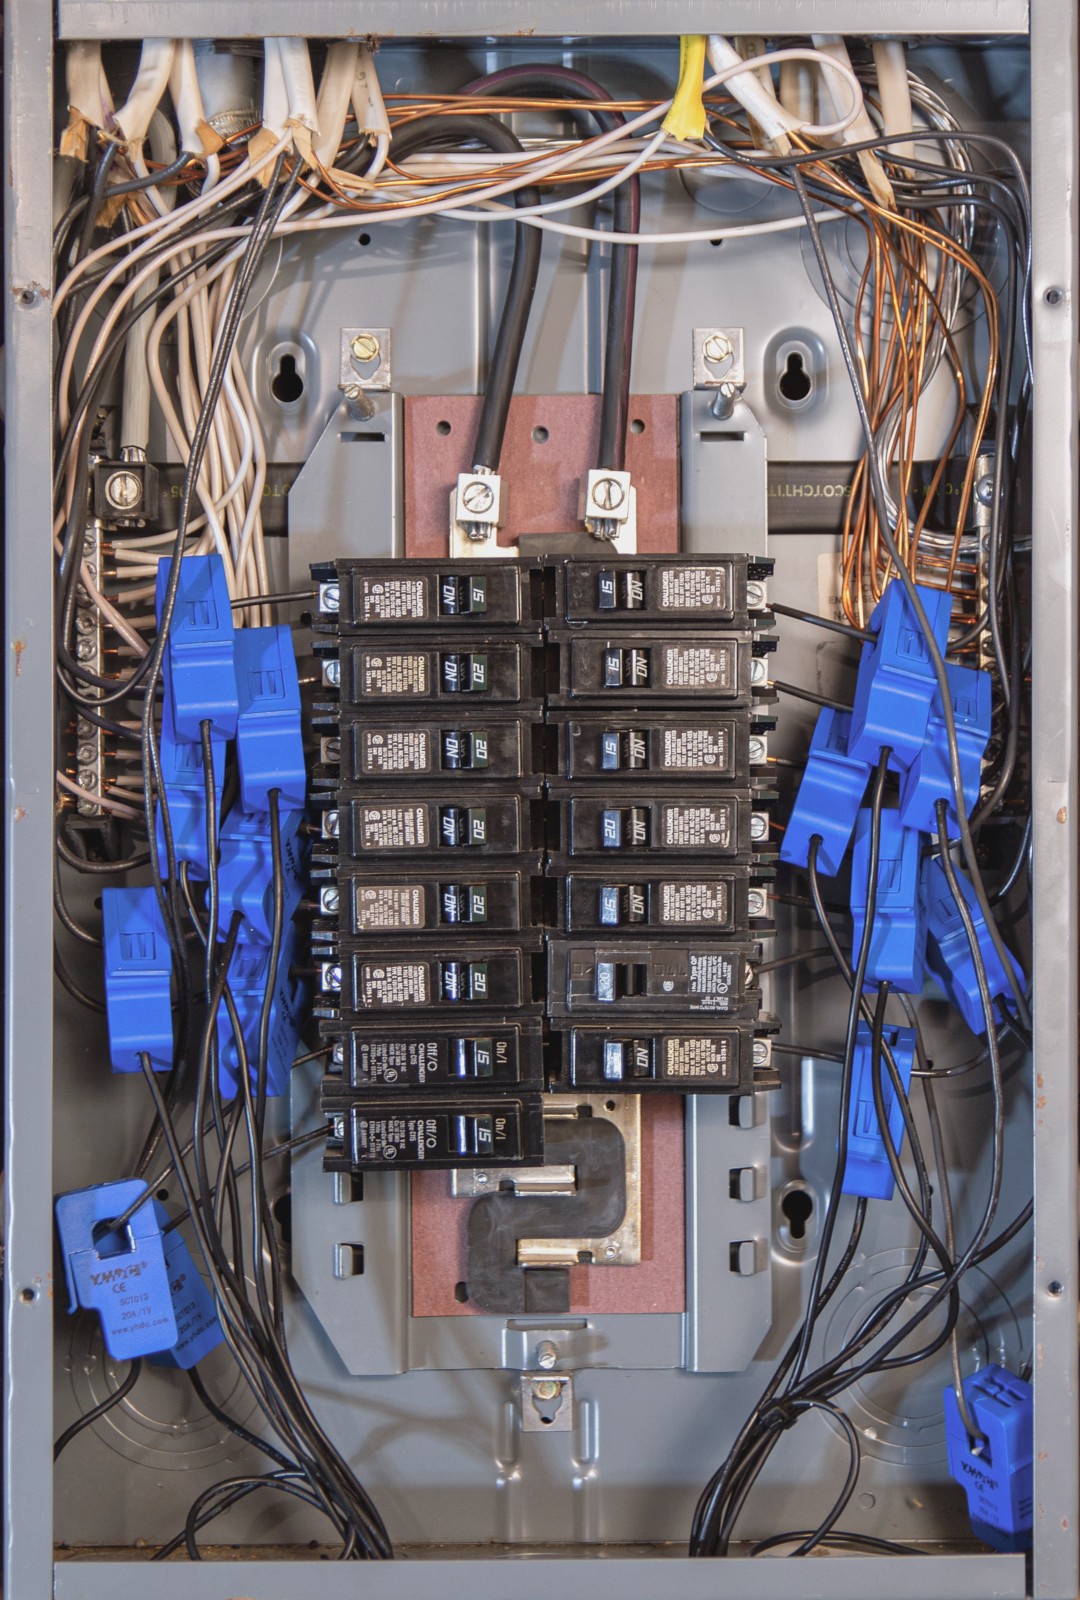
An avid DIYer, I thought to myself, "Well how hard could this be? I can see the current transformers and AC transformers that these other monitors use. P=IV, right? So I just need to sample the voltage and the current back to back as fast as I can and add it all up in software." I set to work soldering together my first breadboard prototype in January of 2020. After getting it all put together I found myself holding a spider web of copper and headphone jacks that didn't look very capable, but after coding together a simple command line app to get a reading from it, lo and behold, it worked! Comparing it to a Kill-A-Watt monitor, I could calibrate it to an incredible accuracy for something that looked like a prop from an 80s B movie. Encouraged by this success, I wrote an entire software platform that could take readings from multiple raspberry pis, or hubs as I started to call them, and aggregate them together into complete energy summaries. To test the software, I soldered together two more breadboard prototypes and was suddenly tracking 45 breakers in my home.

Seek and Destroy
Armed with this new tool and its vast array of data, I was ready to answer the questions I'd been asking about how to optimize my home. First question, how much does it cost to heat the entire upstairs at night with a heat pump, versus only heating our bedroom with a space heater when it's above freezing? I compared two days with the same average and low temperatures. Using the heat pump to heat the entire upstairs, four rooms, when it was above freezing took 15kWh. Heating only our master bedroom with two space heaters at the same outside temperature took 17kWh. Ok, when it's above freezing, go ahead and heat the entire upstairs and enjoy the comfort.
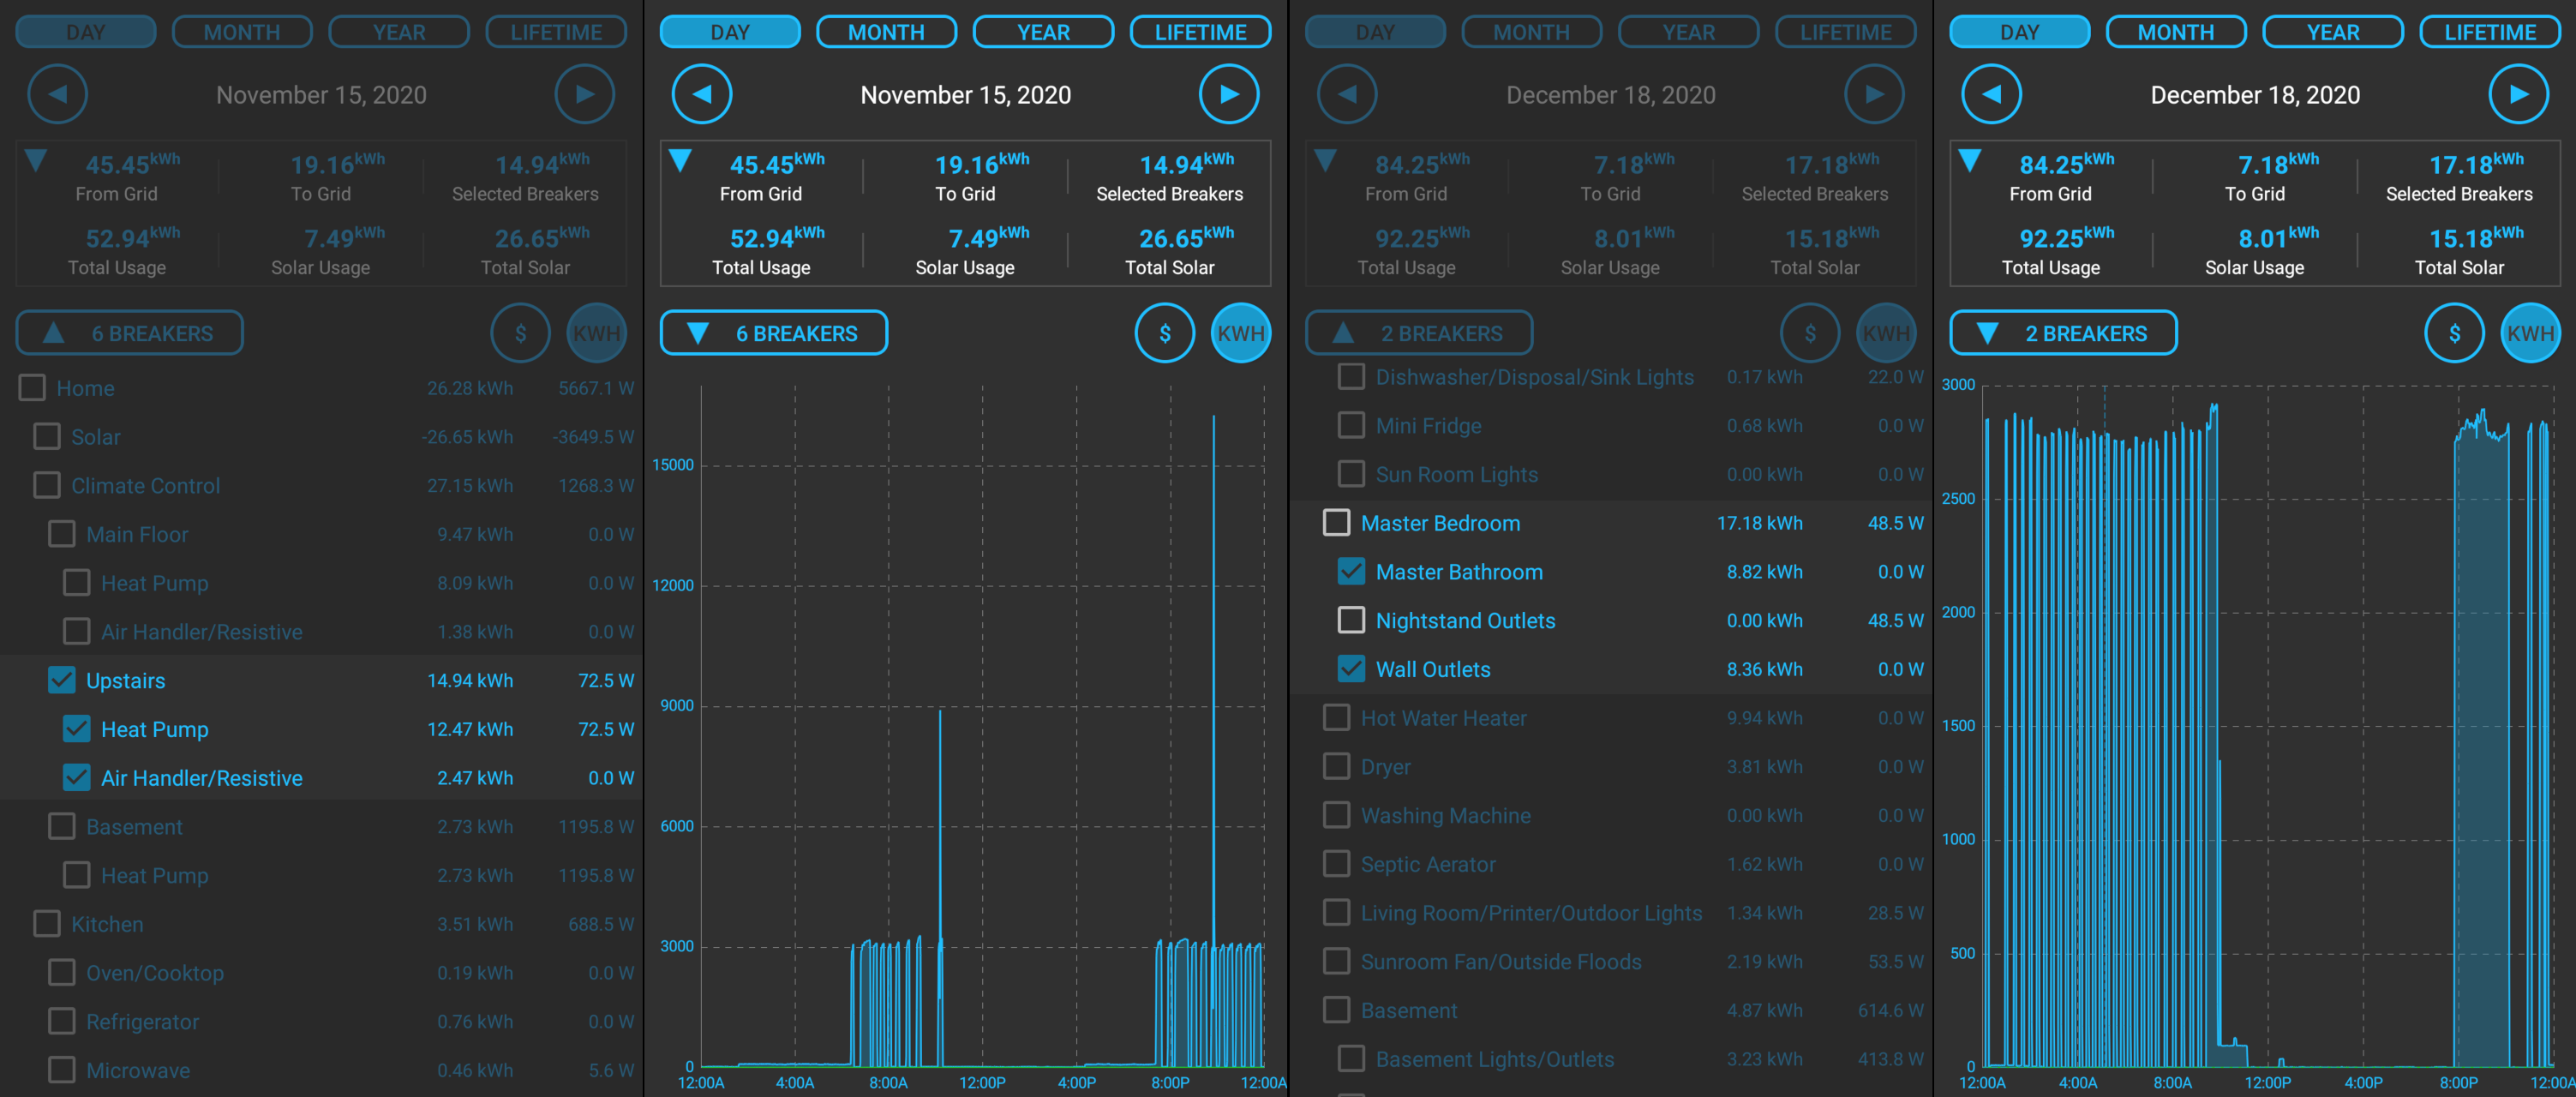
And how does it look when it's below freezing? When the central furnace electric backup heat engages, it takes over 16,000 watts!! It's no wonder the lights flicker when it turns on. At only 10pm, the central furnace had already used 50kWh of electricity. Test aborted, no more data needed! With space heaters in our bedroom the next day, we were able to heat our bedroom all day for 35kWh. The downstairs heat pump does a little extra work to compensate for most of the upstairs not being heated, but the savings of not using the resistance heat upstairs more than outweighs the additional cost of the downstairs running a little longer while we're sleeping. It's clear that we need to avoid engaging that centralized backup resistance heat at all costs. These heat pumps are nearing their end of life and I think we'll be shopping for a geothermal heat pump system moving forward.
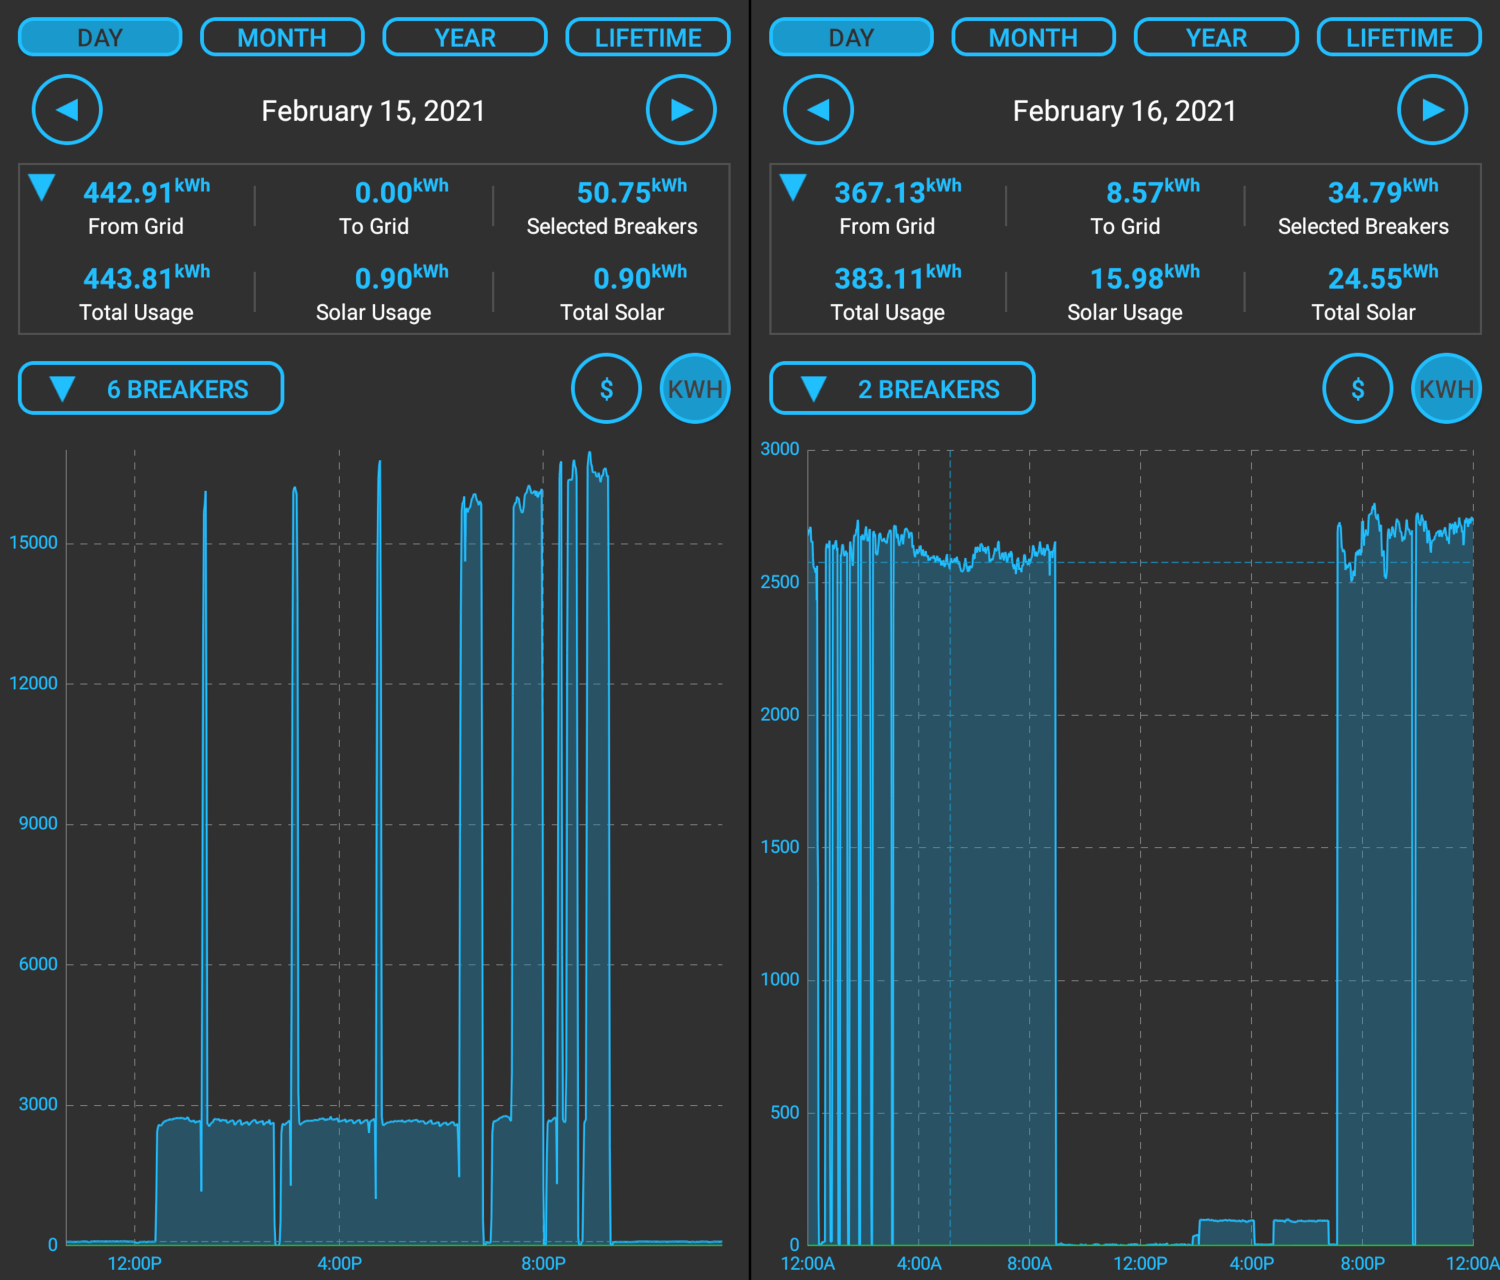
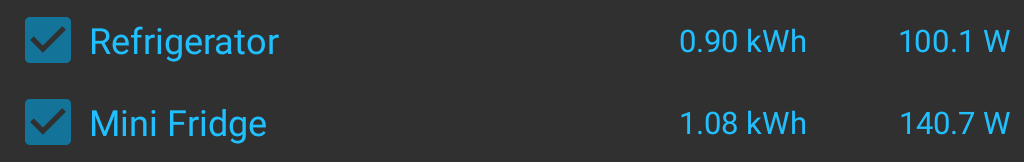
I was able to answer a lot of small simple questions. The house came with a glass door mini-fridge. I wasn't wild about the glass door and wondered how it compared to our new full-size fridge with a solid door. The full-size fridge is on its own breaker and the mini-fridge shares a breaker with a few kitchen outlets that aren't used most days. On a day when the mini-fridge and the full-size fridge are the only appliances in use, the mini-fridge consistently uses about 20% more electricity despite being about a quarter of the volume and not having a freezer. Turning it off and keeping everything in the big fridge saves 36kWh or about $4 per month.
How about the ceiling fan in our kitchen dining area? This is a tall room and we use the ceiling fan to bring some of the hot air down. It's a bit subjective, but it does make the room feel warmer, so we like to run it. 80W on high, 40W on medium, 20W on low. Medium and high create too much of a breeze anyway, so we can leave it on low for half a kWh per day to make it feel a little nicer in there.
We found that our septic aerator control module was broken, resulting in it running constantly at 300 watts, or an extra 200 kWh per month! I had been paying a company to come inspect the septic system twice per year. That "inspection" amounted to opening the lid and making sure it wasn't backed up. They failed to notice that the mechanical switch had cracked and failed. They wanted $400 to replace it with another mechanical switch that would undoubtedly fail too. I opted to fix it myself with a $5 solid-state relay attached to my power monitor. It turns it on for 15 minutes at the top of the hour like clockwork now. That's 150kWh or about $18 saved per month on the septic system alone.
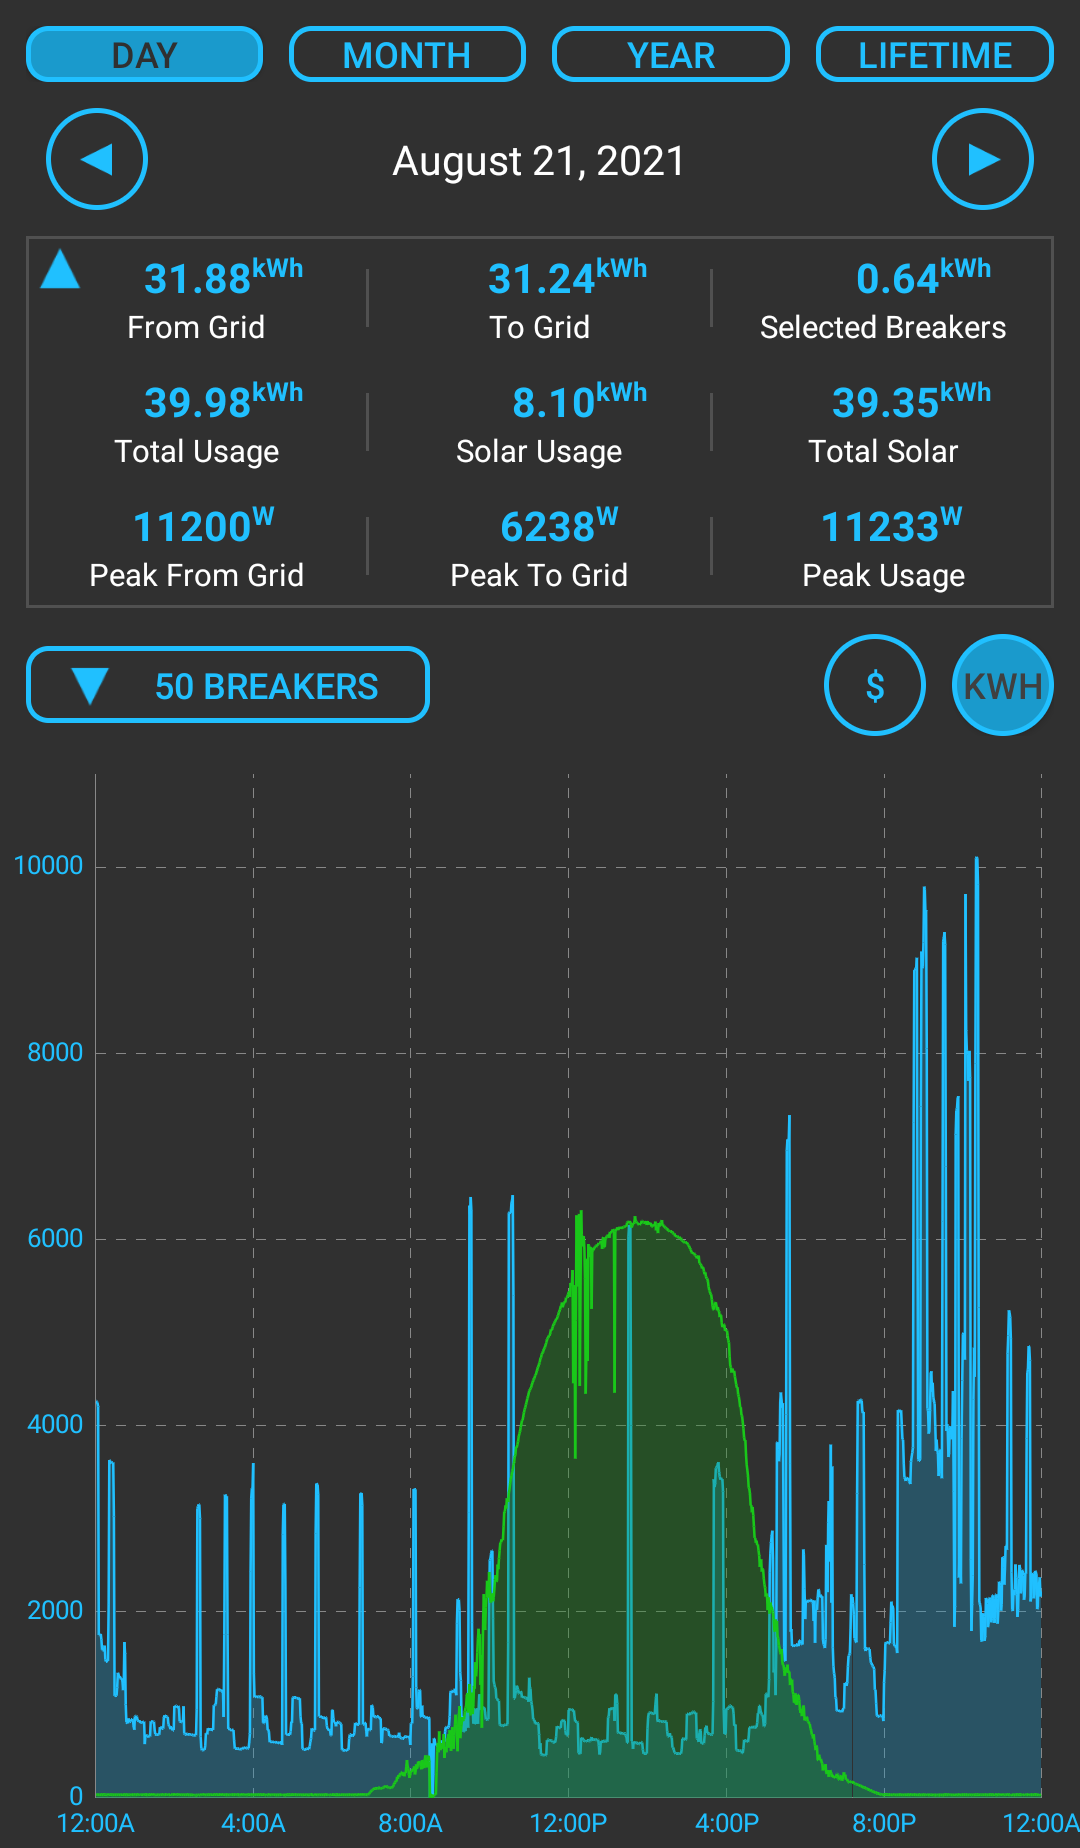
In April of 2019, we had an 8kW solar array installed and turned on. Having solar panels opens up a variety of new ways to optimize your usage. By tracking all of the consumption and all of the production, we can calculate "from grid" and "to grid" readings per second and track peak values across any time frame. That gives you the two values needed to size a battery backup system to go completely off-grid; the capacity needed in kWh and the power rating in kW. Fortunately our electricity provider offers net metering so until we lower our consumption to the point where we're meeting our needs with solar, we're better off feeding the power back into the grid during the day. As more and more people turn to residential solar, there won't be enough consumers to accept the over-production during the day. If large scale storage is not solved by then, it will be important for individuals to calculate their own needs for storage.
Divide and Conquer
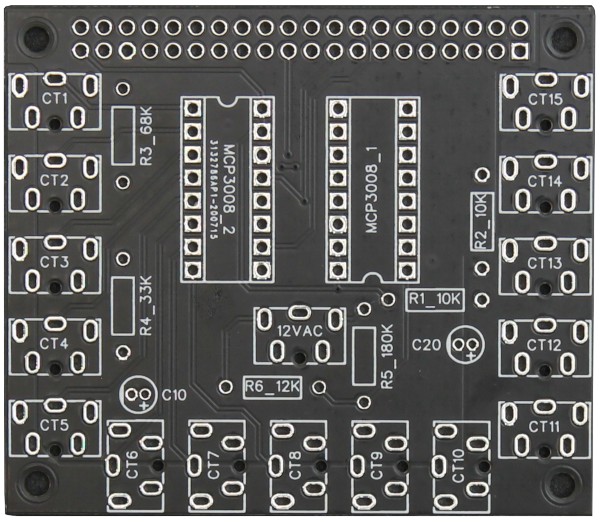
I was so happy with the quality of data that I was getting and the decisions it was allowing me to make, I decided to work on making it possible for others to build their own. That meant two things, releasing all of the source code, and creating a PCB design for the hardware. I could hardly expect anyone to solder together a rat's nest like my prototypes. I put the code and PCB design on github, available for anyone to download and use. I also put a feature in the Android app that allows anyone to generate a bill of materials that will give them a complete list of every single component they need to purchase to be able to assemble one. A few dozen people have used the open source materials to create and run their own power monitors, but for most people, ordering a board from a PCB manufacturer and assembling a hub is too much work. I often get requests to sell completed PCBs and completed power monitors. Kits and pre-built power monitors were made available from our Kickstarter back in January. I'm currently fulfilling the rewards from that campaign and should be finished sometime in early March. I have purchased extra PCBs, current transformers, and voltage transformers and I will be making them available for sale here on this website around the end of March.

The Road Ahead
Now, after using our power monitor for a year and a half, our worst electricity bill of the past year was $320, down from the previous owner's $600. Our best bill was $56. As we complete projects moving forward, namely replacing the windows, upgrading the heat pumps, and improving the attic insulation, we'll be able to analyze exactly how much each improvement is helping. With that knowledge, we can make a target for lowering our consumption and increasing our production to achieve our goal of living in a carbon neutral home.